
The last time study you’ll run by hand
Continuous Improvement Insights times every step at every station on every cycle, and attaches the video to every outlier. No stopwatch, no clipboard, and no operator working differently because somebody is standing there timing them.
Live in two weeks. No MES integration required. Runs on the same camera feed as the rest of Operator Vision
The study takes months and the number is wrong anyway
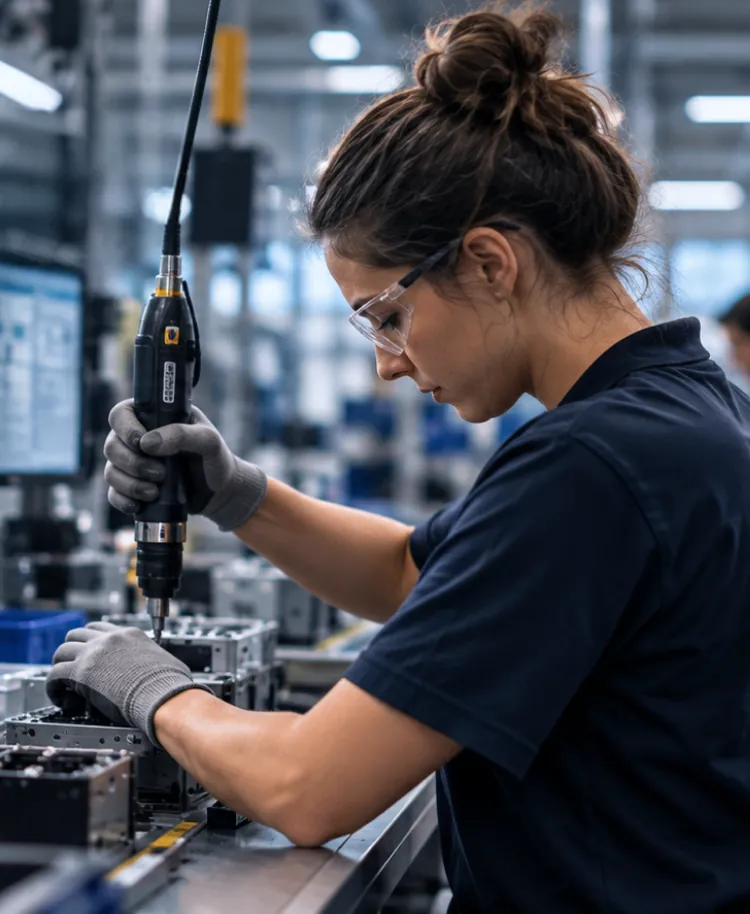
Ask a continuous improvement engineer what eats their year and you’ll hear the same answer. Time studies. Weeks of standing at a bench with a stopwatch, then weeks of cleaning up the data, on a fraction of the stations that need it. The result has three problems. It covers a handful of cycles rather than a shift. Two engineers studying the same station produce two different numbers. And the moment an operator knows they’re being timed, the work changes, so the study describes an audit rather than a job. Then it goes out of date. The line changes, the mix changes, and the standard on the wall stops matching the standard on the floor. Your line balancing documents go stale the same way, built on numbers from a study no one has repeated since. No one notices until somebody runs it again.
What a time study should show
- A full picture of the shift
- Consistent, repeatable data
- How the work normally happens
- A standard that stays current
A reliable standard for balancing the line.
What actually happens
- Only a handful of cycles
- Different engineers, different numbers
- Being observed changes the work
- The data quickly goes out of date
The real process drifts from the written one.
Step-level data that never stops arriving
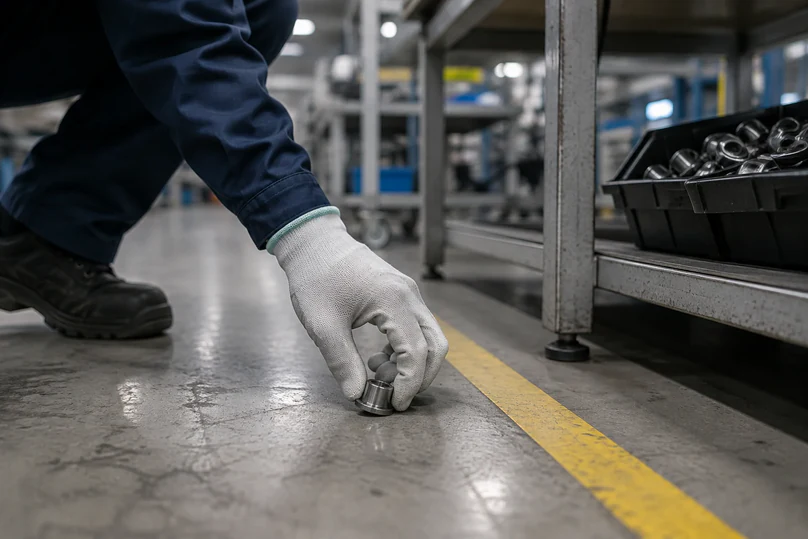
Every step timed on every cycle
Average, minimum, and maximum per step, by station, by shift, and by SKU. Not a sample, and not a snapshot
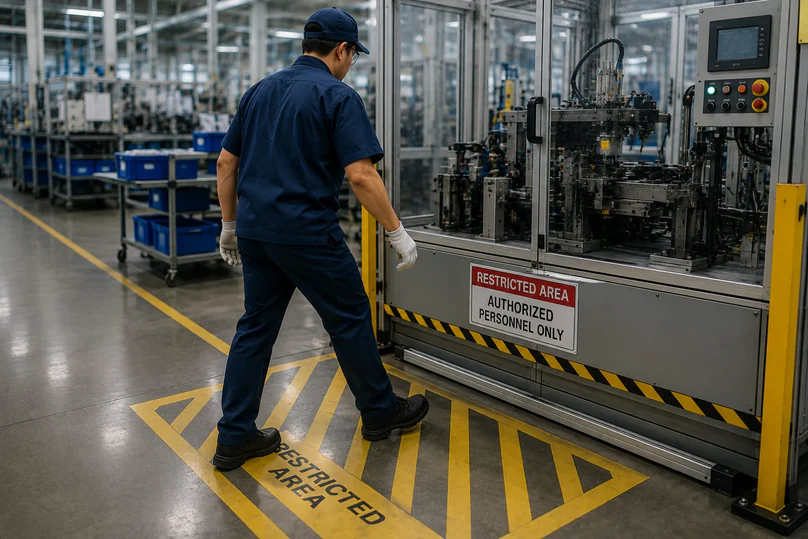
Video on every outlier
When a cycle runs long, the footage of that cycle is one click from the number. You see what happened rather than inferring it
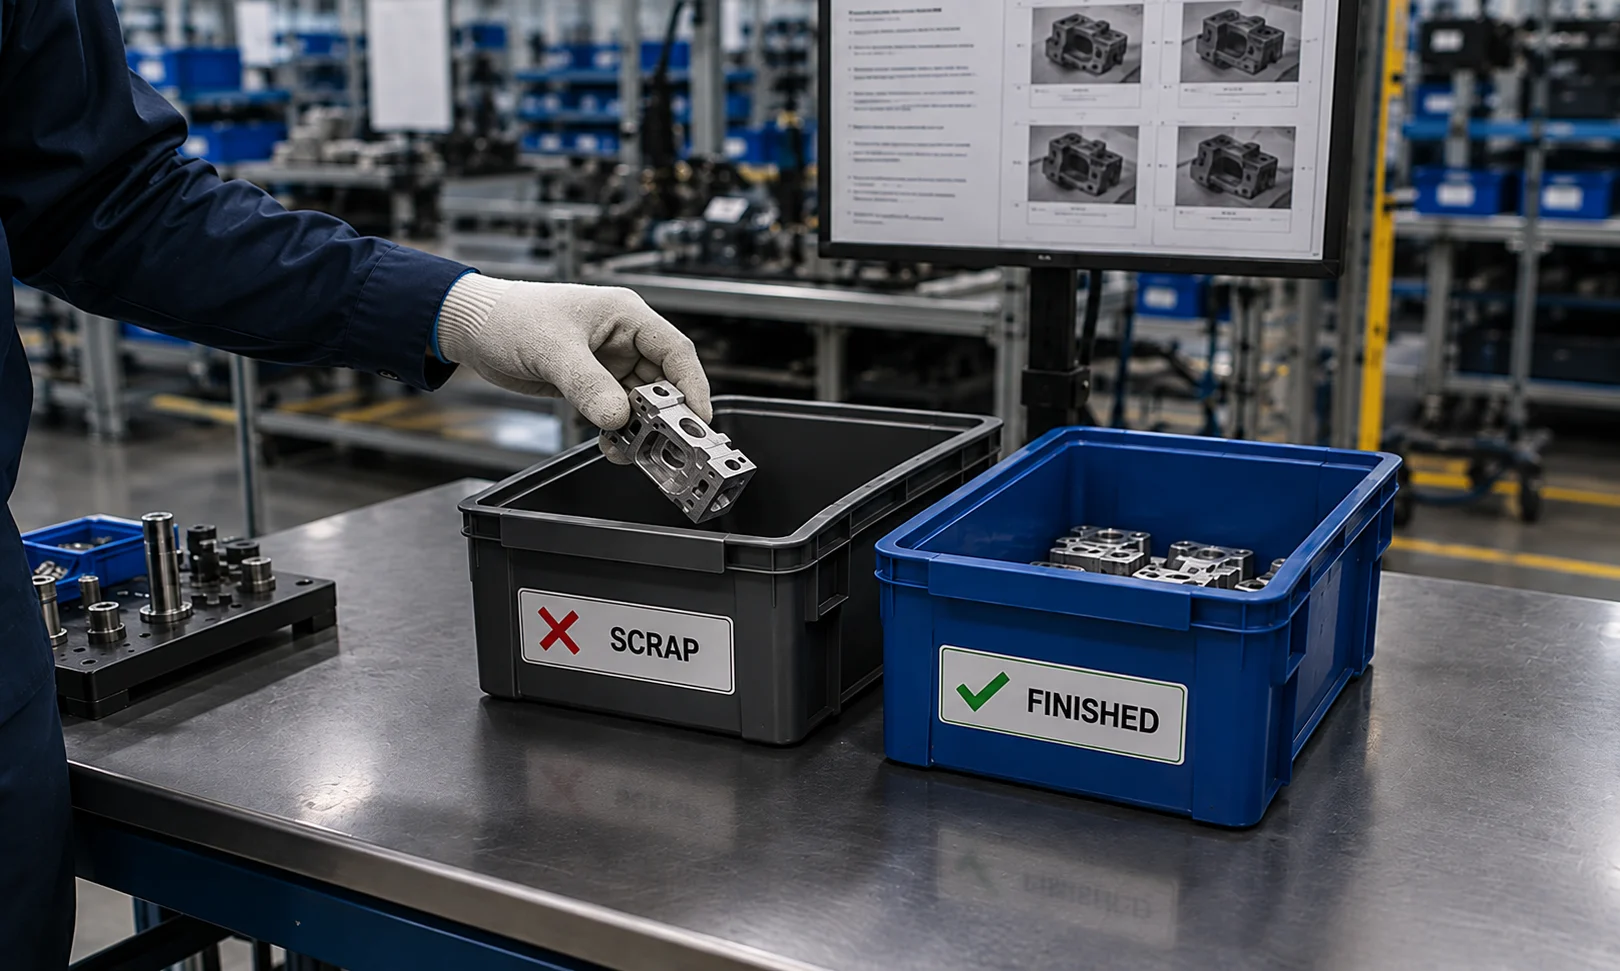
Distribution, not just the mean
The average hides the problem. What matters is the spread, and how often a step runs well outside it.
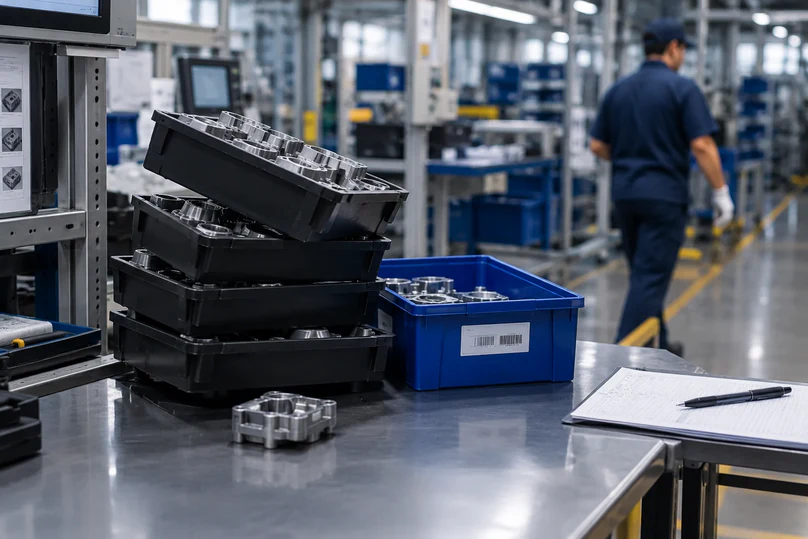
Variance across shifts, stations, and sites
The same work compared against itself, which is the only comparison that tells you anything.
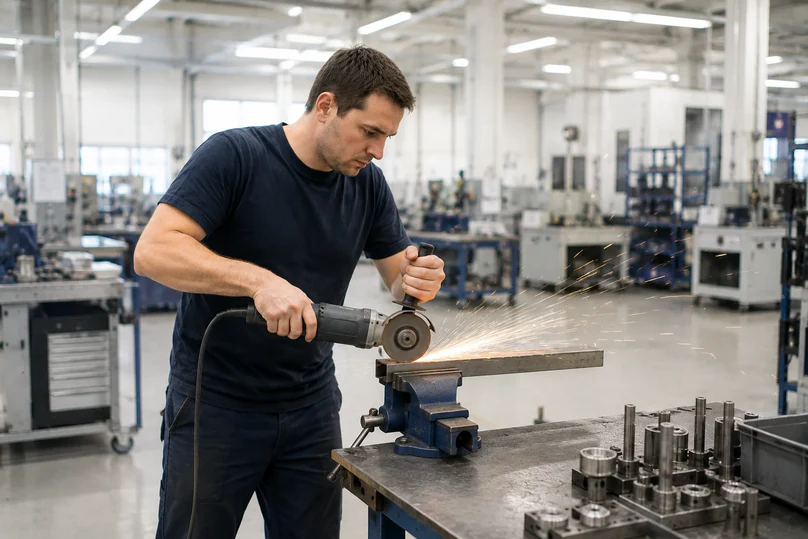
Value-added against everything else
Waiting, walking, searching for a tool, and reworking in place all get separated from the work that actually builds the unit.
The questions no one in your plant can currently answer
Why did that cycle take twice as long?
The step timeline shows which step ran over, and the video shows what happened during it.
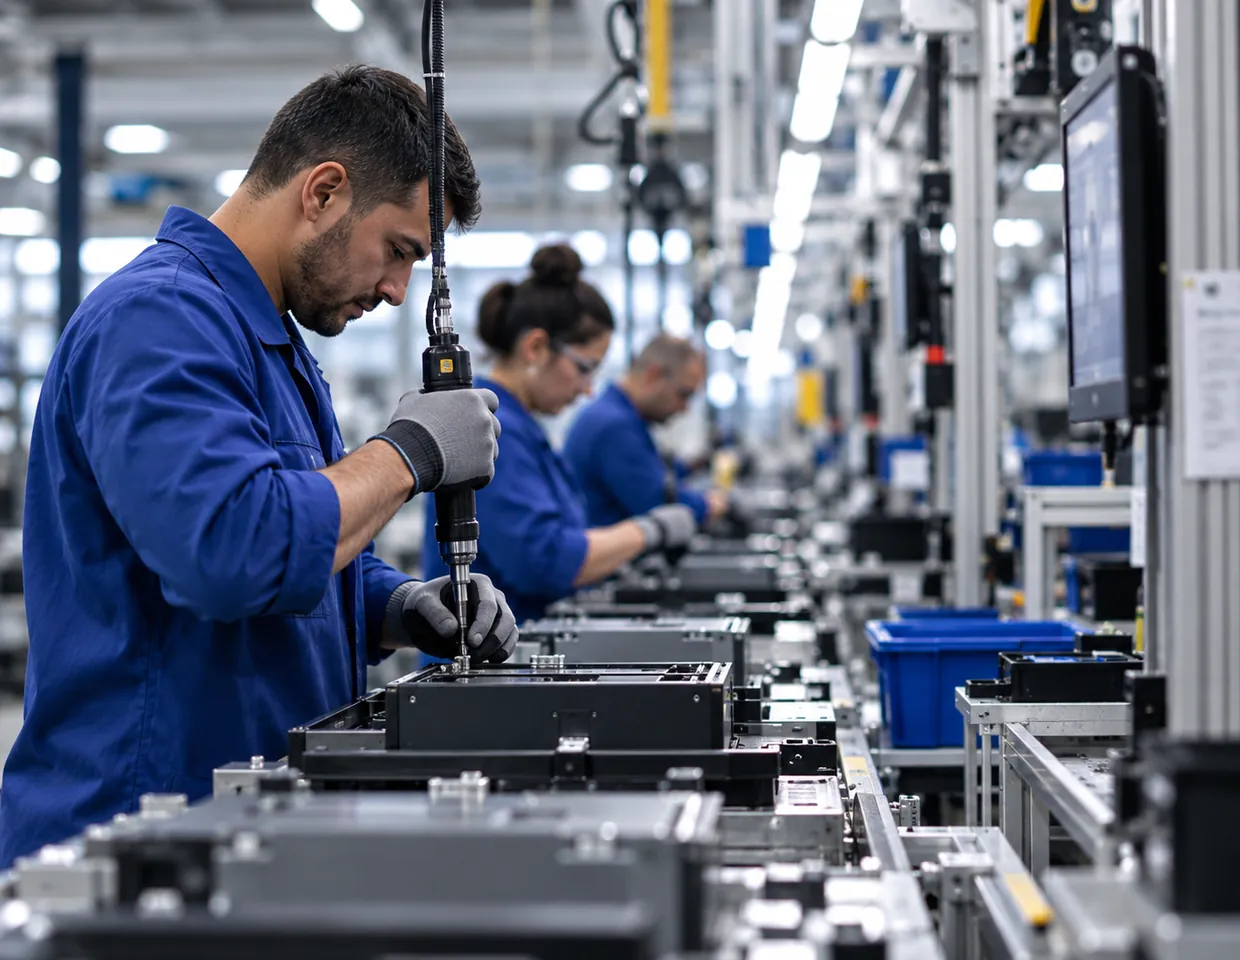
Your work instructions in, step-level data out
- STEP 01
You send the work instructions you already have
Operator Vision reads them and learns the steps for that station.
- STEP 02
Assembler AI calibrates against your floor
Two weeks of watching, then a pass through everywhere the footage and the document disagree. The steps your operators actually perform get reconciled with the steps the document describes
- STEP 03
Timing runs on every cycle
Every shift, including the one no one observes. The data starts describing the job rather than the audit within about a week, once the camera stops being new
- STEP 04
The data lands where your team works
Dashboards by station, shift, step, and SKU, with time comparisons and CSV export for anything you want to take into your own reporting.
The operator fixes it on the spot
Cycle time data is a reporting tool, but drift is worth catching while it’s still happening, and the operator usually knows why before anyone else does.
FIRST
The operator
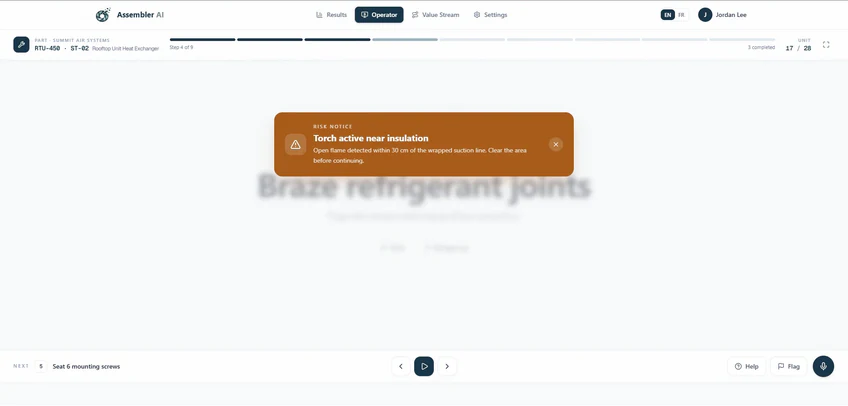
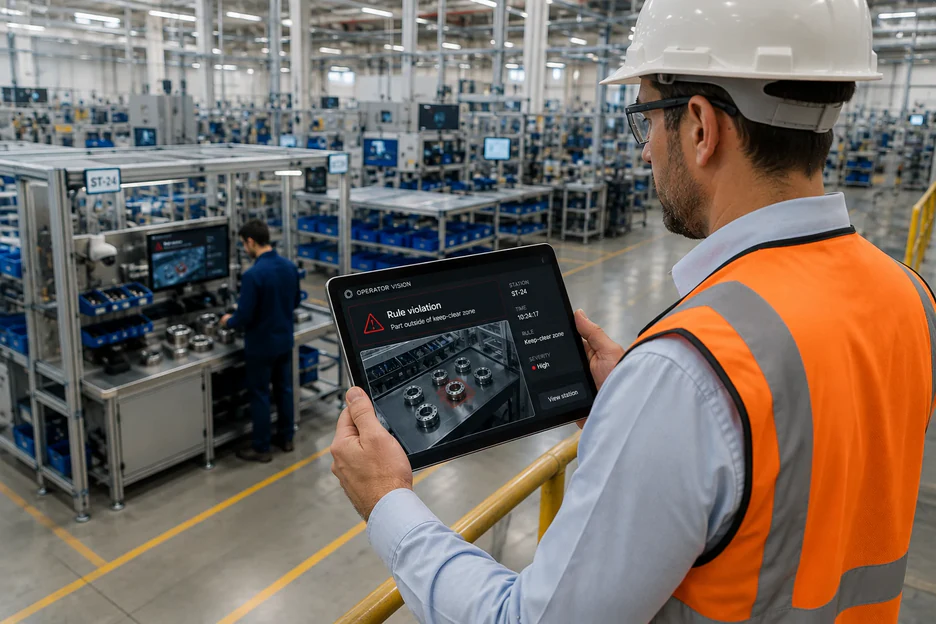
When a step runs well outside its band, the alert reaches the operator guidance screen at the station while the work is still in front of them.
back
The operator answers back
From the same screen they can tell you what’s actually going on. Waiting on material. Blocked by the station upstream. A tool that isn’t working. That turns a number into an explanation, and it arrives from the person closest to the problem
next
Your supervisor
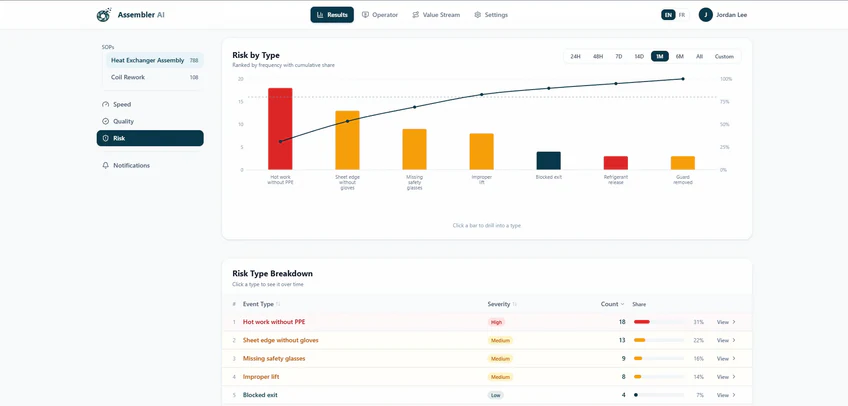
If nothing comes back from the station, the alert escalates with the video attached.
ALWAYS
The dashboard
The alert reaches the station the moment it fires, while the piece is still at the bench and the fix costs a few seconds of extra work. The screen shows what triggered it and gives the operator a way to respond, acknowledge, or tell engineering the rule needs adjusting.
Where the hours come back
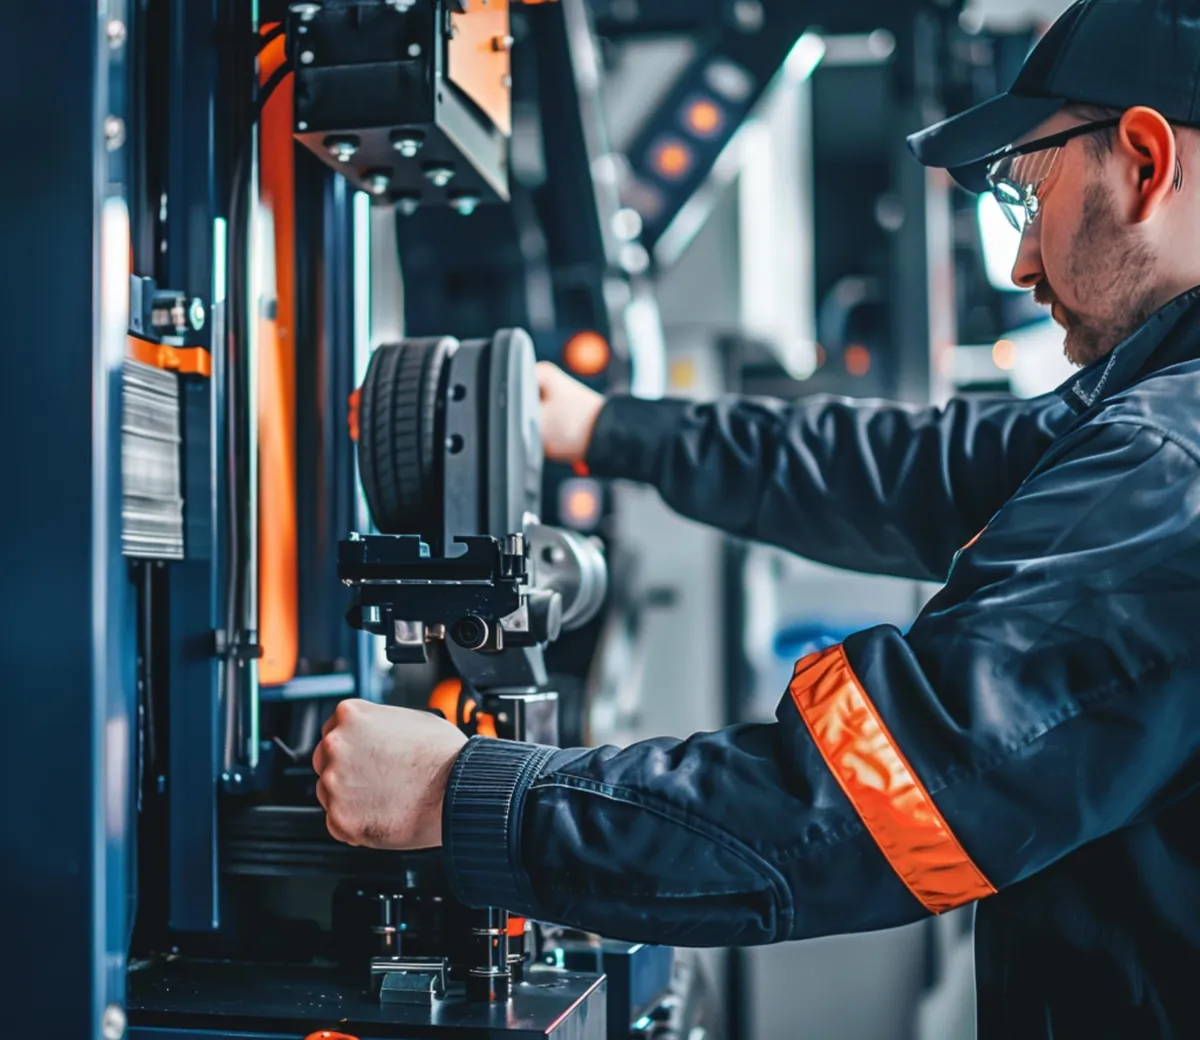
Half your time study workload Assembler AI builds to a simple target: give a continuous improvement engineer back half the time they currently spend on manual studies. The stations you never got to are covered by the same camera you put on the one you did. Line balancing without the video editing The usual workflow is capturing three cycles per station, separating the cycles by hand, cutting a video for every step, and loading all of it into balancing software to be averaged. Operator Vision produces the same step times continuously and without the editing. Standards that hold When an operator consistently beats the work instructions by doing it differently, you have the footage. Sometimes the right outcome is changing the work instructions, and now you can prove which way round it should go. Throughput Acting on step-level variance by SKU, shift, station, and factory is where the recovered time shows up as output rather than as a report.
Where the time study problem bites hardest
Aerospace and defense
Long builds across many stations, where flow time and build time diverge and no one can see where the hours go
See aerospaceAutomotive components
Setup variance between operators and shifts on lines already under a price-down clause
See automotiveMedical devices
Hand-built work under GMP, where standardizing the method matters as much as measuring it
See medical devicesHVAC
High mix, where every order runs a little differently and the standard is an average of things that never happen twice
See HVAC
If a person at the station could see it, so can Operator Vision
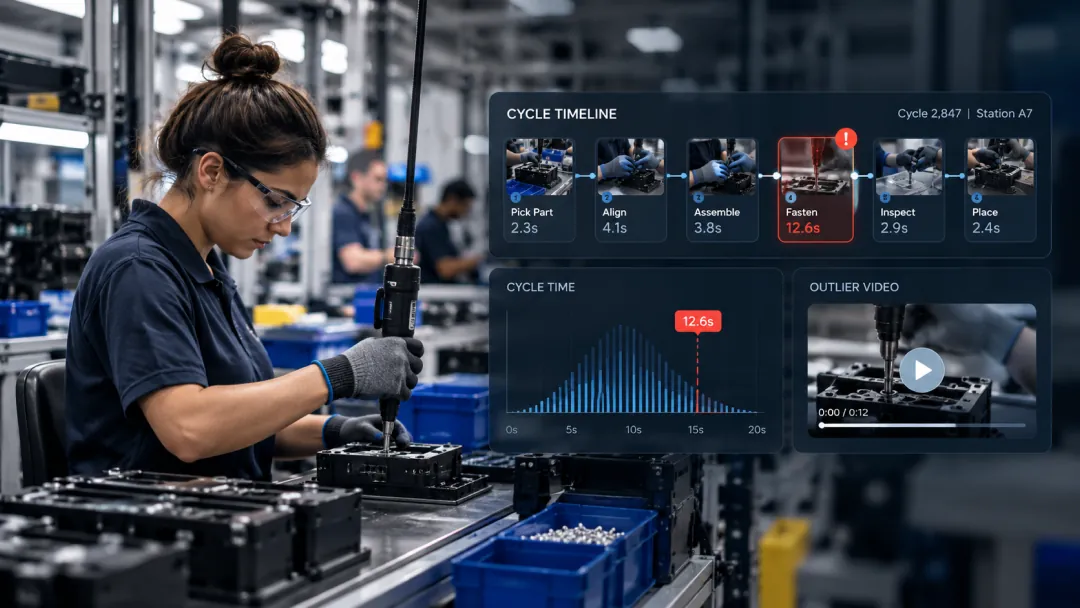
Every step and how long it took
On every cycle, on every shift, without anyone standing there
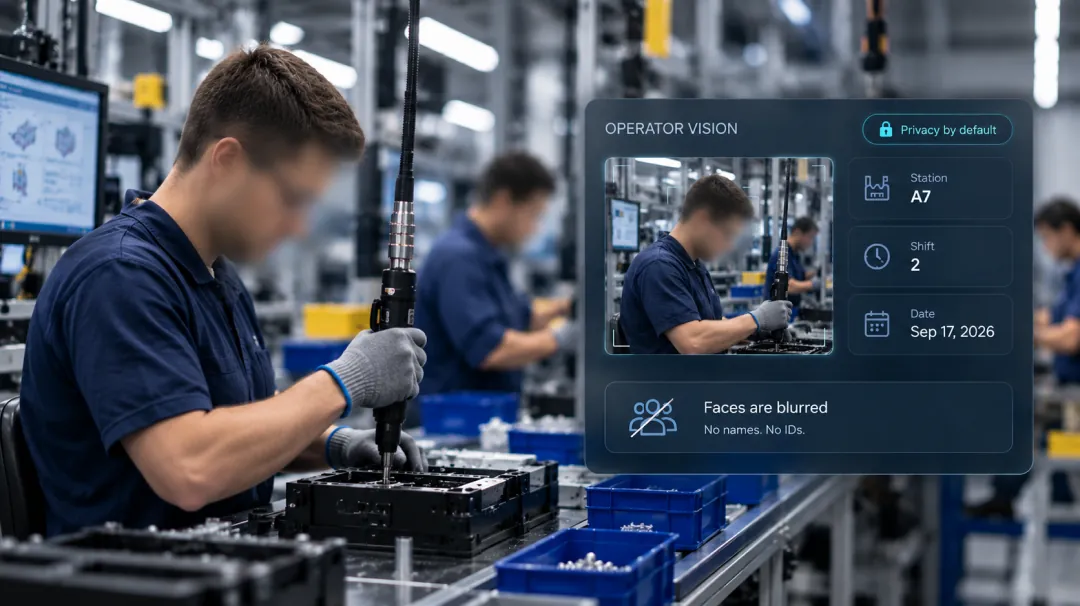
Who it doesn’t identify
Faces are blurred by default. Operator Vision doesn’t collect operator names or IDs, and the data comes back tied to a station and a shift. Variance between people is visible as variance between runs, which is the version that leads to a better standard rather than a difficult conversation.
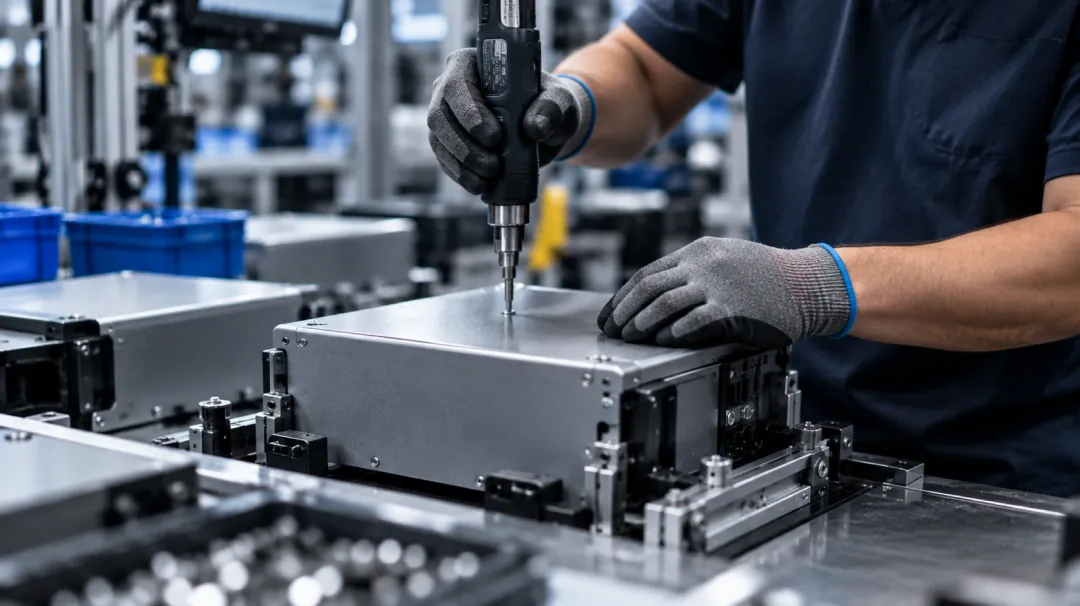
What sits inside a closed housing
Not visible to a supervisor standing there either. What gets timed is the work around it.
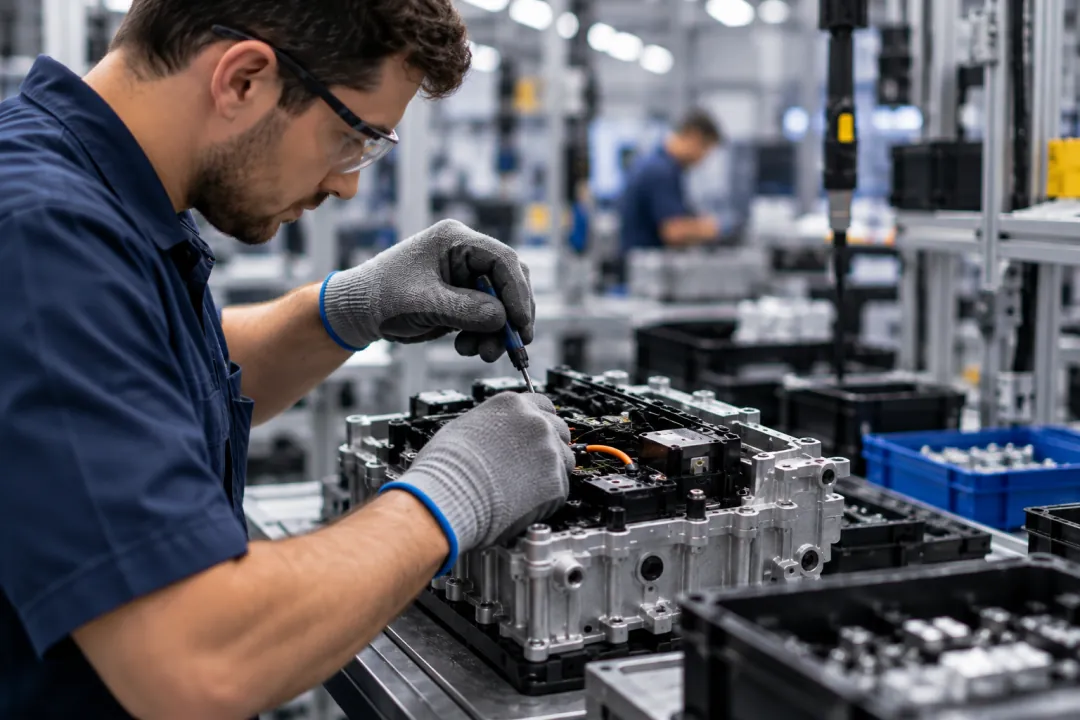
Detail at the scale your station allows
Steps that genuinely can’t be told apart from above are identified during calibration rather than after go-live, and Assembler AI would rather tell you a step isn’t separable than time it unreliably.
Two weeks to a live station
Send your work instructions on day one. The camera goes up in week one, NDAA-compliant hardware Assembler AI supplies and provisions, on its own subnet, streaming out over an encrypted VPN. Week two is calibration and training the model on your station. Data goes live on day fifteen. That’s two weeks on a station with one operator, closer to three where several people share a bench. Stations after the first go up in parallel, so covering a line or a plant is measured in weeks rather than one station at a time.
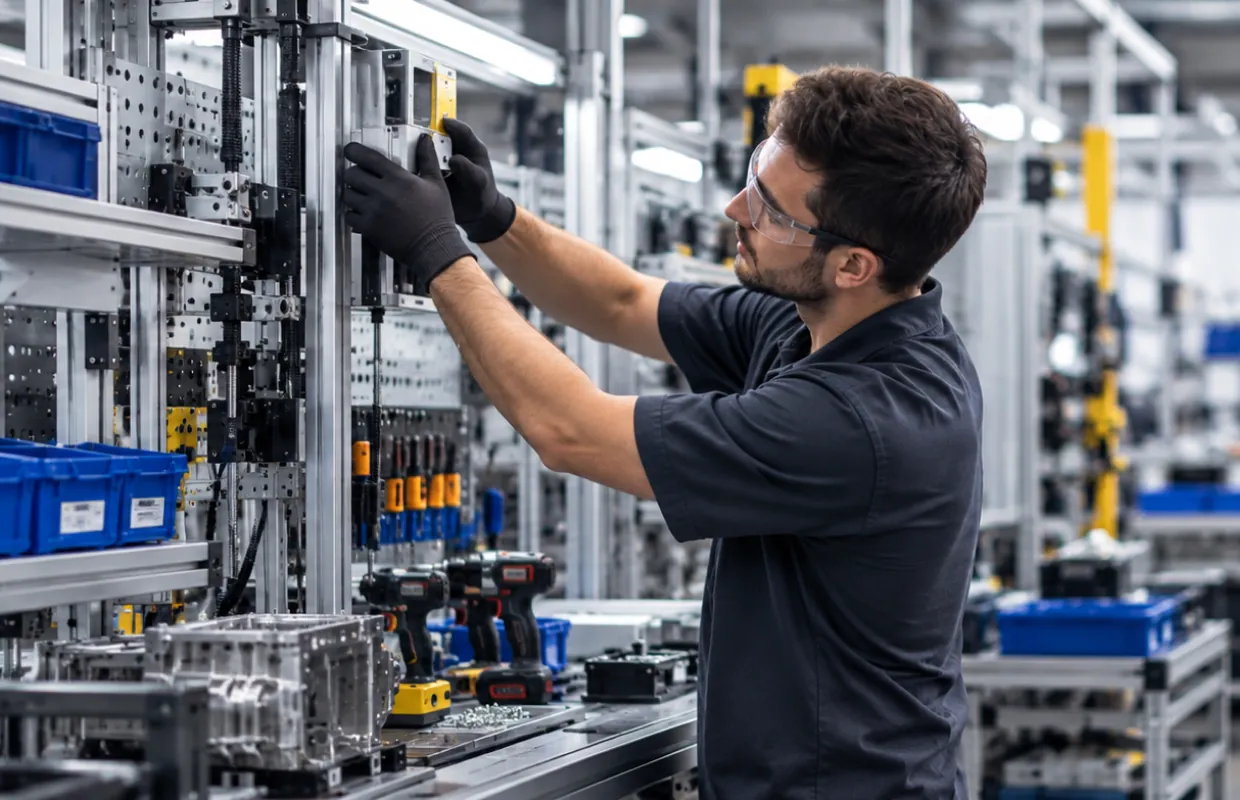
Start with one station. The data gets more valuable with every one you add
No one instruments a plant on a vendor’s promise. So you start small, with the station you’d study next if you had the time. Two weeks later you have step-level data on it, continuously, without sending anyone to stand there.
What happens after is worth understanding before you begin. This data is comparative, so every station you add makes the ones you already have more useful.
One station
How the work actually happens against how it’s written, and where the time goes.
The line
Stations running the same work become comparable. Balancing stops being a quarterly exercise and becomes something you can check on a Tuesday.
The factory
Shifts and cells compare against each other. The night shift question gets an answer, and process changes get measured against how the station ran before them.
Across sites
The same build in two plants becomes comparable for the first time. The best method anywhere in your group becomes the standard everywhere, backed by video of somebody actually doing it.
A single station gives you a number. A factory gives you a distribution. A group of plants gives you a benchmark no consulting study could produce, and unlike a study it keeps updating itself as your work changes. If you’re heading toward multiple sites, tell Assembler AI early and we’ll scope single sign-on, role-based permissions, and per-site data separation with your IT and HR teams while the first station runs.
Questions your team will ask
Coverage and honesty. A manual study covers a handful of cycles on a handful of stations, and the operator works differently while it’s running. This covers every cycle on every shift, and after about a week the camera stops being new and the data starts describing the job.
Yes, the data as CSV and the video alongside it. Dashboards cover station, shift, step, and SKU, with side-by-side comparison of two time periods. Whatever your team already reports in, the numbers and the footage behind them can go there.
No. Faces are blurred and no names or IDs are collected. Variance shows up as variance between runs and between shifts, tied to a station rather than a person.
Times are sliced by SKU. Where your SKUs look visually different, Operator Vision identifies which one is in production and switches automatically as the station changes over.
It surfaces it. Ghost steps in work instructions are one of the most common findings in the first two weeks, alongside steps your operators perform that the document never captured.
Waiting, walking, searching, and rework in place are separated from the work that builds the unit, which is usually where the recoverable time turns out to be.
Assembler AI’s proprietary manufacturing vision models start around 80 percent accuracy on a new station and reach the mid 90s after the initial calibration. Those first two weeks are what get it there on your station rather than in a demo.
If the steps stay the same, a new part shape is usually fine. If the steps change, you upload the new work instructions and Operator Vision is retrained against them.
Pick the station you’d study next if you had the time
One camera, two weeks, and the study runs itself from there.
No MES integration required, and it scales easily across your sites.
Insights on how manufacturers are using Assembler AI to boost cycle time and quality
Stay updated with the latest news, ideas, and product updates.